By Sagi Shaier · 7 October 2026 · 3 min read
Big-O notation for machine learning
Big-O notation describes how the work an algorithm does grows as its input gets bigger. This post explains what it keeps and what it drops, the growth rates you will meet (O(1), O(log n), O(n), O(n log n), O(n²)), and why an all-pairs method that is fine on a thousand items fails on a million.
Big-O notation describes how the amount of work an algorithm does grows as its input gets bigger. It does not count exact operations. It describes the growth pattern, so you can compare two methods without getting lost in how each one is implemented. In machine learning the input is usually the number of examples, features or tokens, and Big-O tells you whether a method that runs in a second on a thousand of them will still finish on a million.
The input size is written $n$. A method that looks at each of $n$ items once is written $O(n)$, read "order $n$."
What Big-O keeps and what it drops
Big-O ignores two things.
Constant factors. $5n$ and $n$ are both $O(n)$. Doubling the input doubles the work in both cases, and that doubling is what Big-O describes.
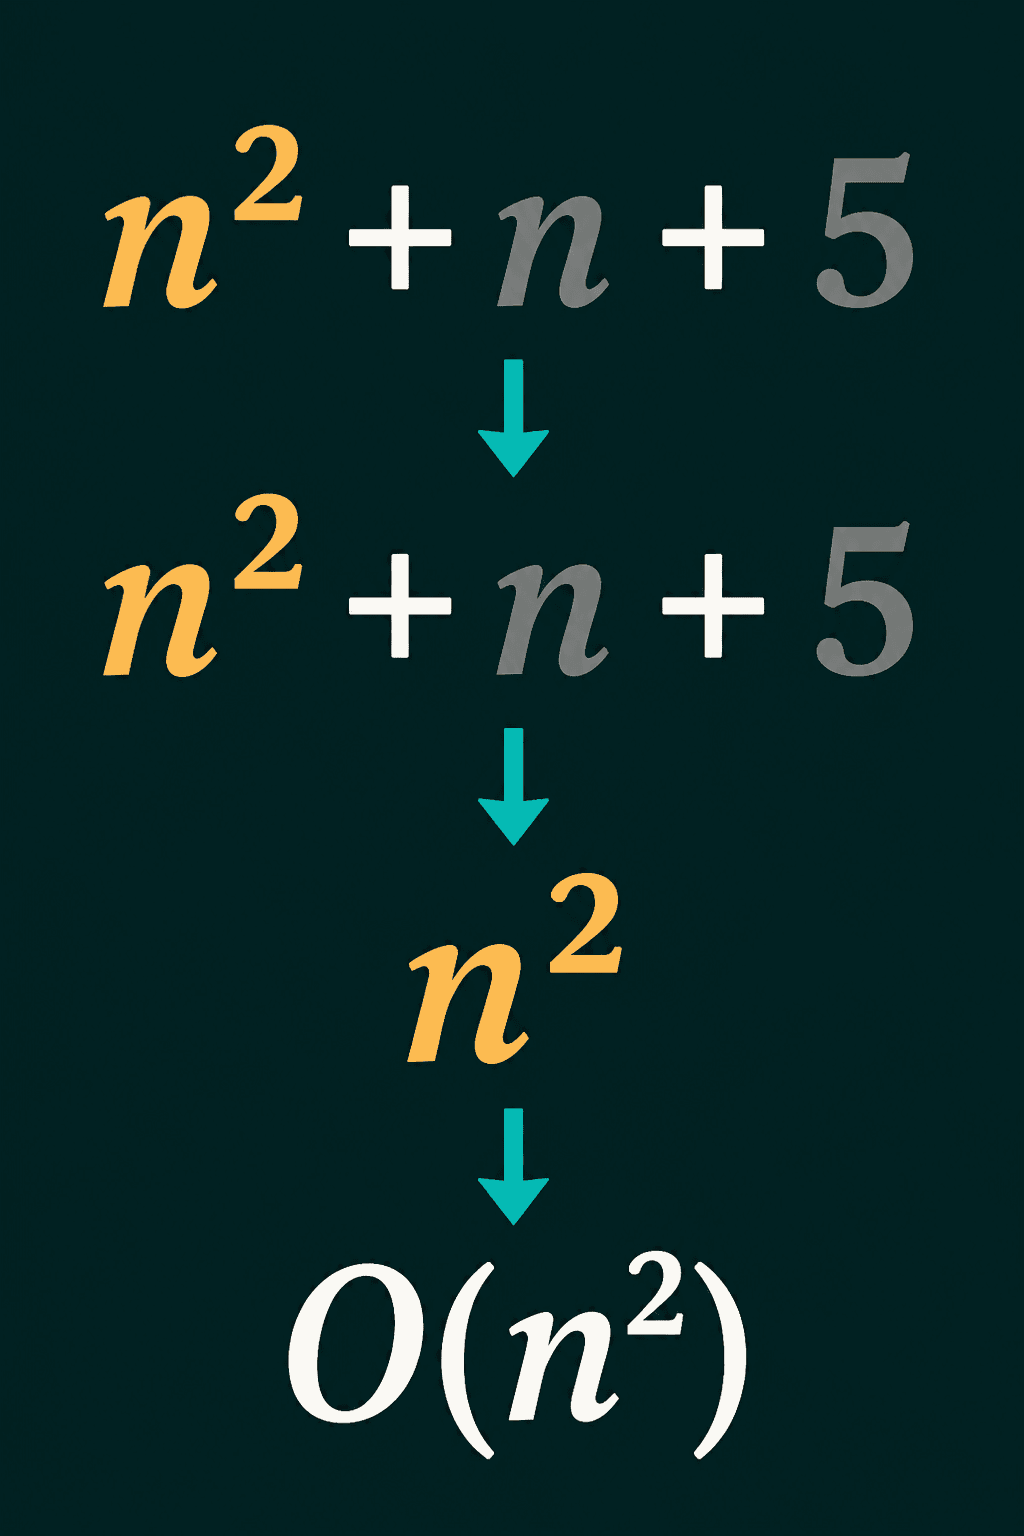
Slower-growing terms. A method that compares every pair of items and then makes one more pass over the list does about $n^2 + n$ operations. Once $n$ is large, the $n^2$ part decides the total and the $n$ is tiny next to it, so the method is $O(n^2)$. The rule is to keep the fastest-growing term and drop the rest:
$$n^2 + n + 5 ;\rightarrow; O(n^2)$$
The growth rates you will see
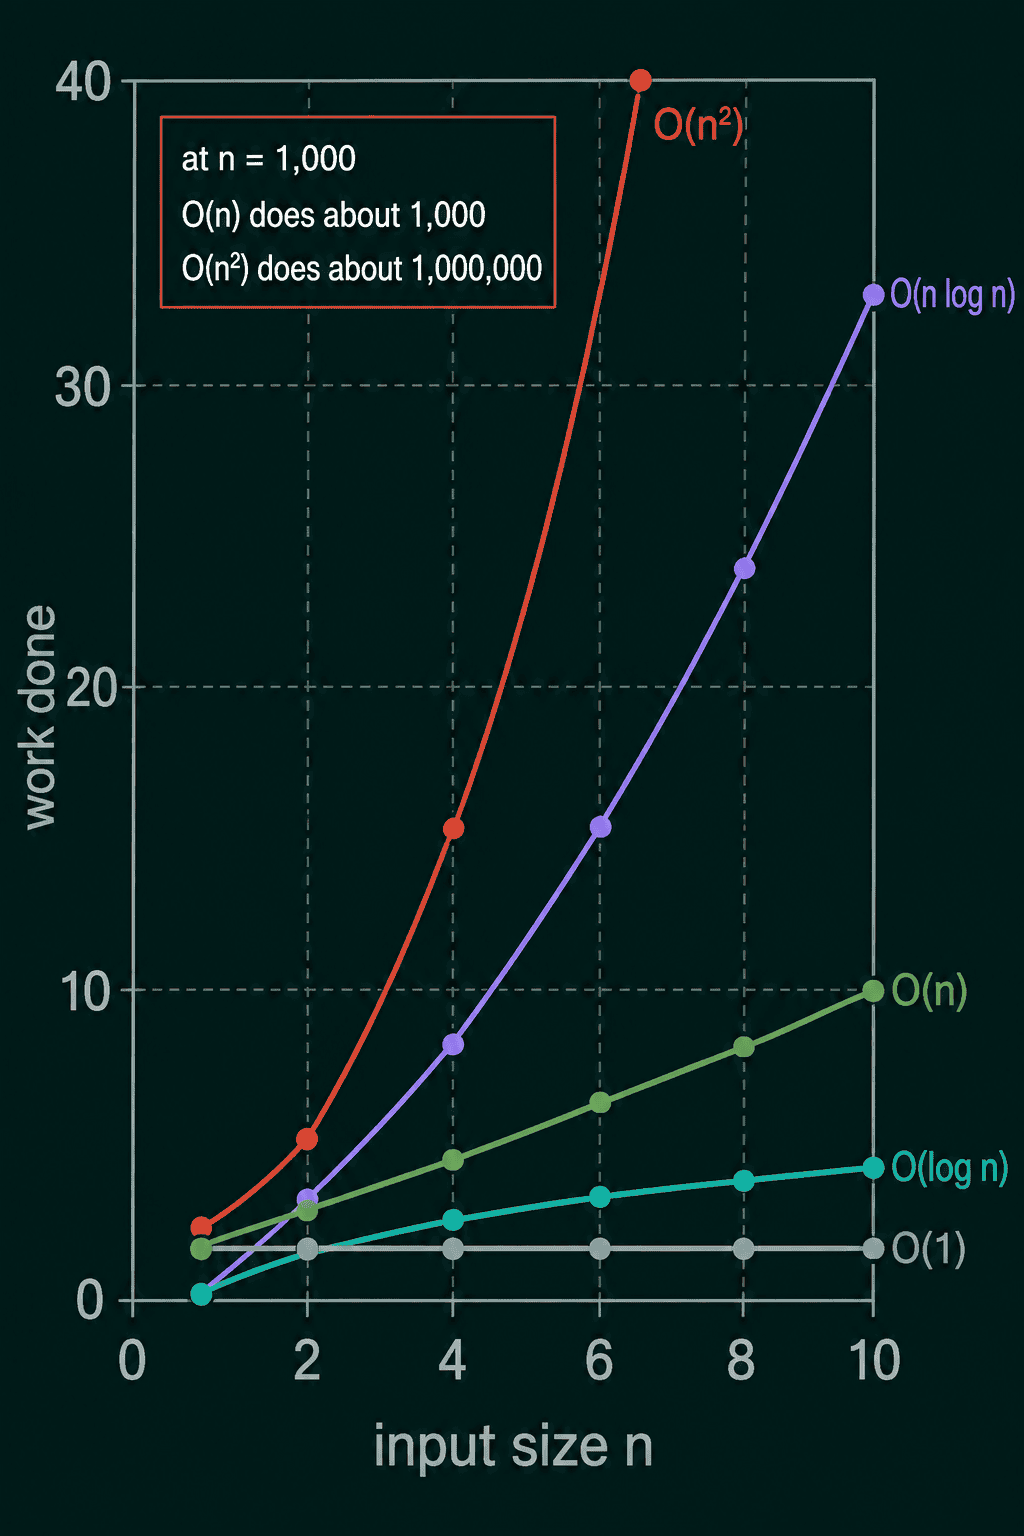
- $O(1)$, constant: the work does not grow with the input, like reading one element of an array by its index.
- $O(\log n)$, logarithmic: doubling the input adds only one more step, like binary search on a sorted list.
- $O(n)$, linear: double the input, double the work, like scanning a list once.
- $O(n \log n)$: slightly more than linear, common in efficient sorting algorithms.
- $O(n^2)$, quadratic: double the input and the work goes up 4 times, like comparing every pair of items. A method that compares each item against every other item is $O(n^2)$.
How big the gap gets
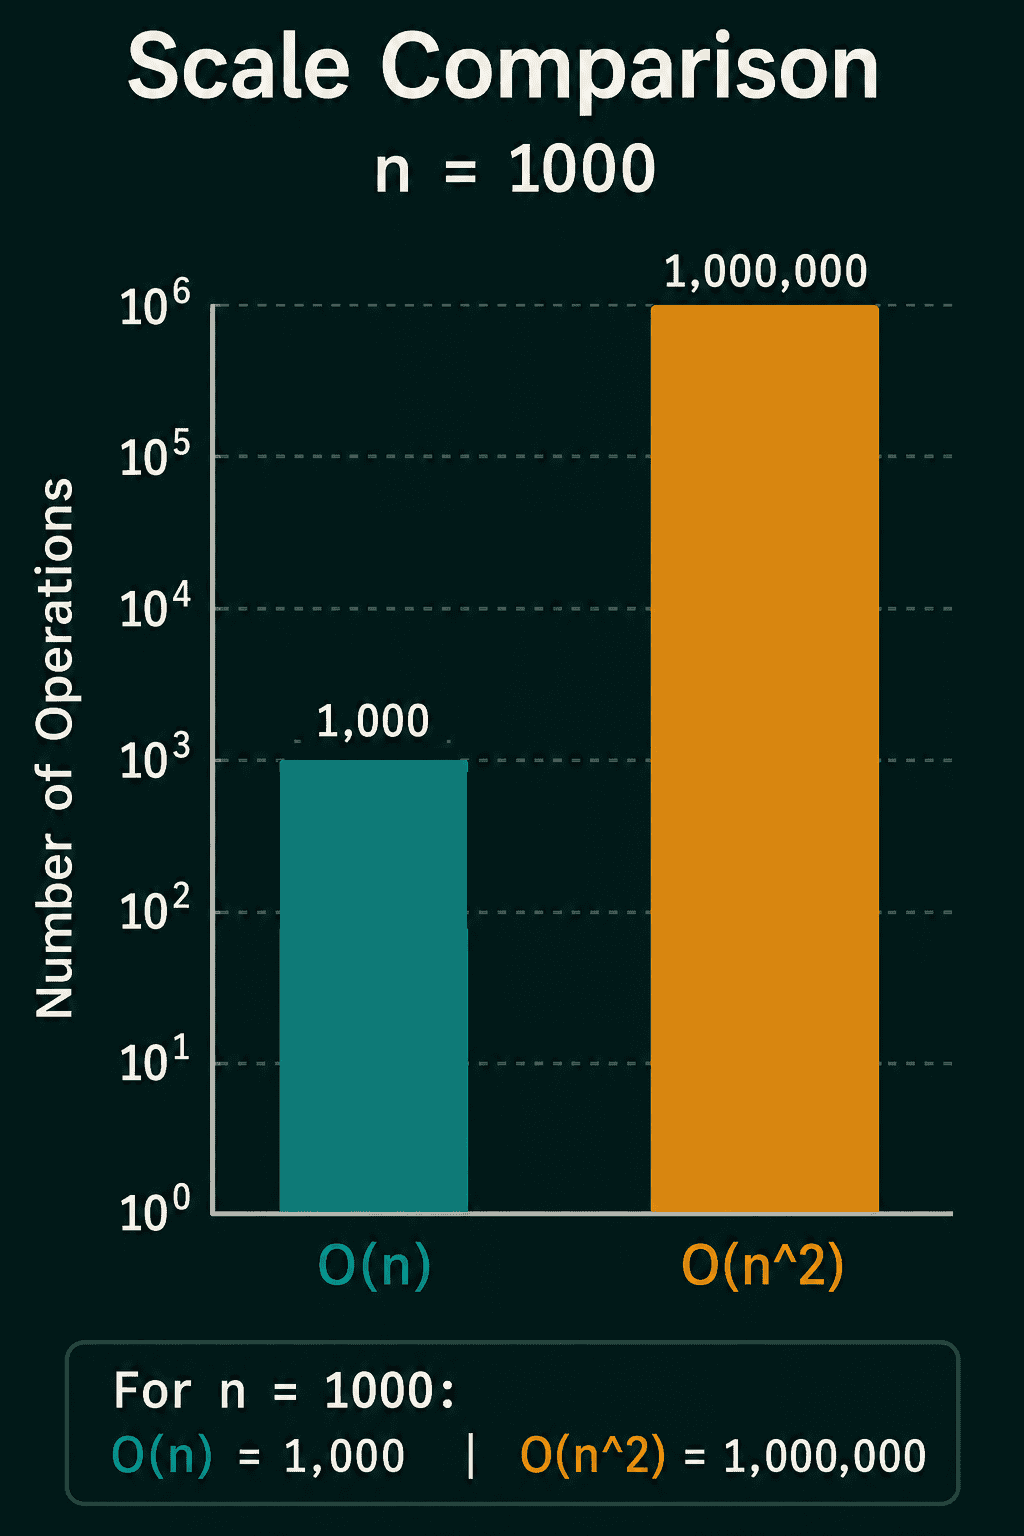
At $n = 1{,}000$, an $O(n)$ method does around 1,000 units of work and an $O(n^2)$ method does around 1,000,000. At $n = 1{,}000{,}000$ the gap is a million units against a trillion. An all-pairs method that is fine on a thousand items is hopeless on a million, which is why a lot of engineering effort goes into avoiding the all-pairs version of a computation.
Counting the work in code
The two functions below count their own steps, one scanning the list once and one comparing every item against every item:
1def linear_scan(items):
2    steps = 0
3    for a in items:            # look at each item once
4        steps += 1
5    return steps
6
7def all_pairs(items):
8    steps = 0
9    for a in items:            # every item...
10        for b in items:        # ...against every item
11            steps += 1
12    return steps
13
14for n in [10, 100, 1000]:
15    items = list(range(n))
16 print(n, linear_scan(items), all_pairs(items))110 10 100
2100 100 10000
31000 1000 1000000Each time $n$ grows 10 times, the scan does 10 times more work and the all-pairs loop does 100 times more. A loop inside a loop over the same list is the usual sign of $O(n^2)$.
The same growth shows up in PyTorch. torch.cdist computes the distance from every point to every other point, so its output holds $n^2$ numbers:
1import torch
2
3x = torch.randn(1000, 2)          # 1,000 points with 2 features each
4dist = torch.cdist(x, x)          # distance from every point to every point
5print(dist.shape, dist.numel())1torch.Size([1000, 1000]) 1000000With 1,000 points that is a million distances. With 100,000 points it would be 10 billion, about 40 GB as 32-bit floats. If an all-pairs step runs out of memory as the data grows, check its size against $n^2$ first.
Common mistakes with Big-O
- Reading Big-O as a speed. An $O(n)$ method with a large constant can be slower than an $O(n^2)$ one on small inputs. Big-O describes how the work grows, not how long one run takes.
- Keeping lower-order terms. $O(n^2 + n)$ is written $O(n^2)$.
- Missing a hidden loop. A call like
x in some_listinside a loop scans the list each time, which turns an $O(n)$ loop into $O(n^2)$. - Testing only on small data. A quadratic step looks fine on 1,000 rows and fails on 1,000,000.
Related math
Logarithms are what make $O(\log n)$ grow so slowly: doubling $n$ adds a constant to $\log n$. They are covered in exponents and logarithms for machine learning. The symbols that appear in cost formulas, such as $\sum$ for a loop that adds terms, are in how to read the math notation in ML papers.
QuiddityML teaches Big-O as its own concept in the Math track, and the exercises include ordering the growth rates from slowest to fastest, putting the lines of an all-pairs function in order, and writing that function from scratch.