5 October 2026 · 7 min read
How to choose an evaluation metric for your model
Accuracy, precision, recall, ROC AUC and R² each miss a different kind of failure. This post shows what each one misses, how to pick one primary metric from the cost of your model's mistakes, and which two or three metrics to track next to it.
An evaluation metric is a number that scores a trained model's predictions against the correct answers. Each common metric is blind to some kind of failure, so a model can score well on one number while failing in a way that number cannot show. A safer setup is one primary metric chosen from what your model's mistakes cost, plus two or three supporting metrics that cover what the primary one misses.
Common metrics for classification and regression
Classification models predict a category, such as "sick" or "healthy". For a two-class problem, each prediction lands in one of four counts: a true positive (a real positive the model flagged), a false negative (a positive it missed), a false positive (a negative it flagged by mistake, also called a false alarm), and a true negative. The 2x2 table of those counts is the confusion matrix, and most classification metrics are built from it:
- Accuracy: the fraction of predictions that are correct.
- Precision: of the cases the model flagged, the fraction that are really positive.
- Recall: of the real positives, the fraction the model flagged.
- F1: a single score that combines precision and recall.
- ROC AUC and AUC-PR: scores for a model that outputs a probability, measured across many decision thresholds instead of one.
Regression models predict a number, such as a house price. Their usual metrics are MSE (mean squared error), RMSE (its square root, in the same units as the target), MAE (mean absolute error), MAPE (mean absolute percentage error), and R², the fraction of the variation in the true values that the model's predictions explain. An R² of 1 means perfect predictions, and 0 means no better than predicting the average every time.
Each of these has a blind spot, a kind of failure it does not register.
What each metric misses
The demo below scores four classifiers on 1,000 patients, 10 of whom are sick. Each model either flags a patient as sick (1) or not (0).
1import torch
2
3def report(name, pred, y):
4    tp = ((pred == 1) & (y == 1)).sum().item()
5    fp = ((pred == 1) & (y == 0)).sum().item()
6    fn = ((pred == 0) & (y == 1)).sum().item()
7    acc = (pred == y).float().mean().item()
8    precision = tp / (tp + fp) if tp + fp > 0 else 0.0
9    recall = tp / (tp + fn)
10    print(f"{name:14s} accuracy {acc:.3f}  precision {precision:.3f}  recall {recall:.3f}")
11
12torch.manual_seed(0)
13y = torch.zeros(1000, dtype=torch.long)
14y[:10] = 1                                     # 10 sick patients out of 1000
15score = torch.rand(1000) * 0.6 + y * 0.35      # sick patients tend to score higher
16
17report("always healthy", torch.zeros(1000, dtype=torch.long), y)
18report("flag everyone", torch.ones(1000, dtype=torch.long), y)
19top1 = torch.zeros(1000, dtype=torch.long)
20top1[score.argmax()] = 1                       # flag only the single highest score
21report("flag top 1", top1, y)
22report("threshold 0.5", (score >= 0.5).long(), y)1always healthy accuracy 0.990 precision 0.000 recall 0.000
2flag everyone accuracy 0.010 precision 0.010 recall 1.000
3flag top 1 accuracy 0.991 precision 1.000 recall 0.100
4threshold 0.5 accuracy 0.825 precision 0.044 recall 0.800Each model fools a different metric:
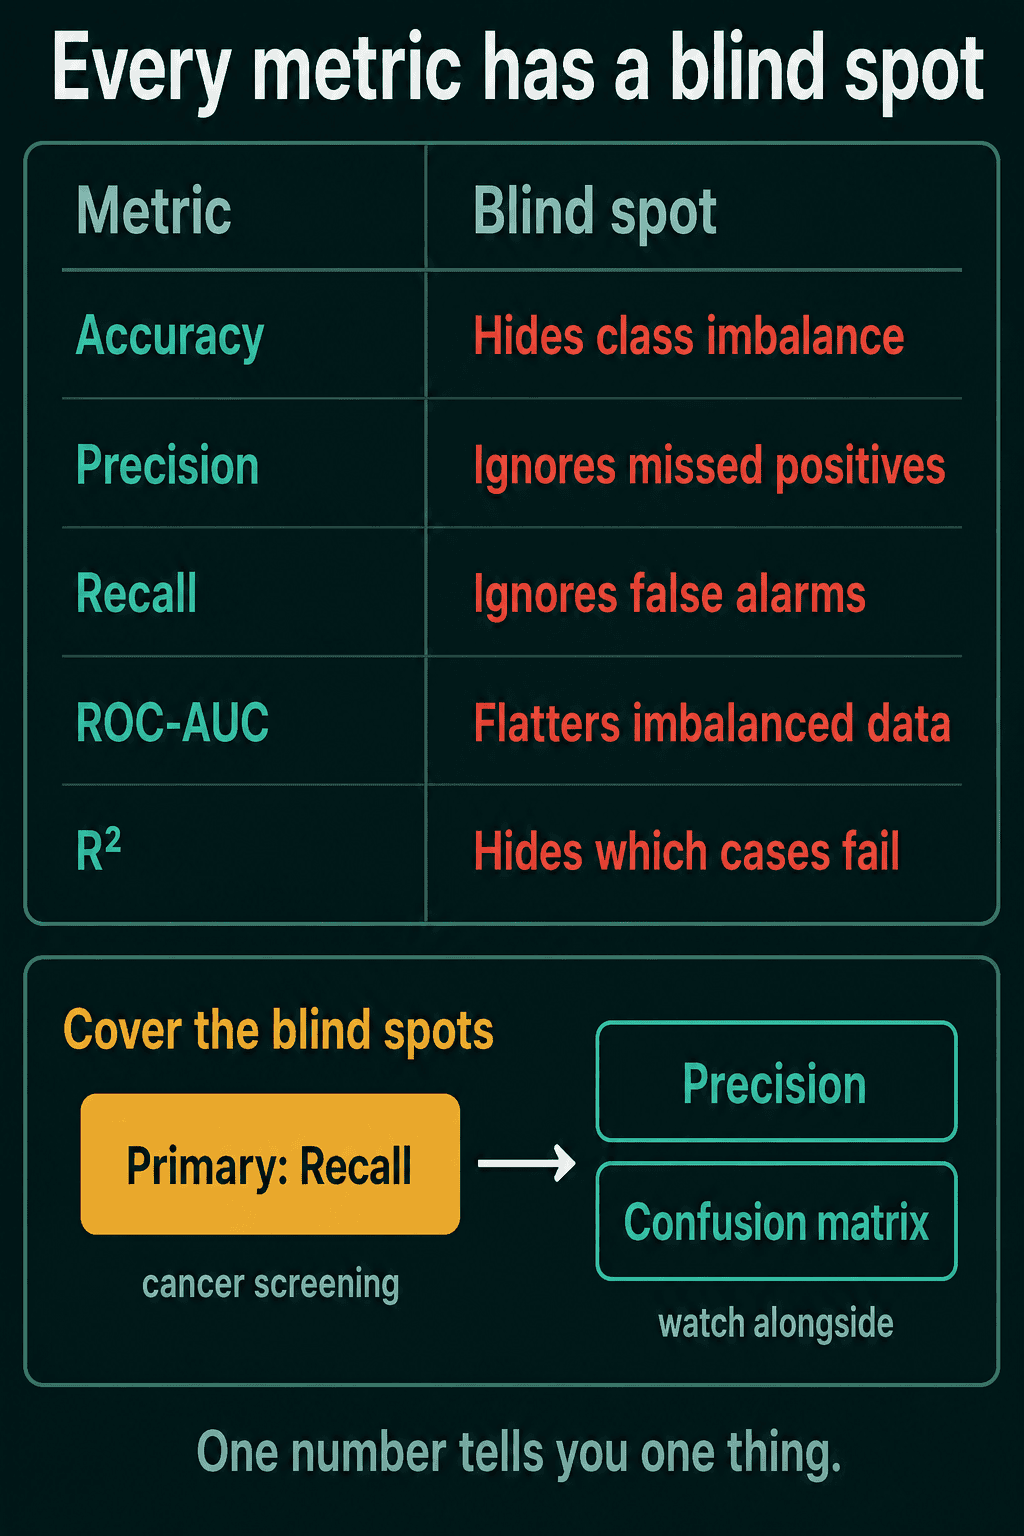
- Accuracy hides class imbalance. The model that calls each patient healthy scores 0.990 and catches none of the 10 sick patients. The threshold model catches 8 of them and scores lower, 0.825.
- Precision ignores what the model missed. Flagging one patient gives a precision of 1.000 while 9 of the 10 sick patients go undetected.
- Recall ignores false alarms. Flagging everyone gets a recall of 1.000 with 990 healthy patients wrongly flagged.
ROC AUC scores how well a model ranks positives above negatives, and on data where the positive class is rare it can stay high while most of the model's flags are false alarms. The ROC curve and AUC post works through an example of that.
R² tells you how much of the variation a regression model explains on average, and nothing about where its errors land. Here a price model is close on 475 houses and undershoots 25 of them by 150,000:
1import torch
2
3torch.manual_seed(0)
4size = torch.rand(500) * 200 + 50              # house size in square meters
5price = 3000 * size + torch.randn(500) * 20000 # true price
6pred = 3000 * size + torch.randn(500) * 5000   # model is close on most houses
7pred[:25] = price[:25] - 150000                # but undershoots 25 houses by 150k
8
9err = pred - price
10r2 = 1 - (err ** 2).sum() / ((price - price.mean()) ** 2).sum()
11rmse = err.pow(2).mean().sqrt()
12print(f"R2 {r2:.3f}  RMSE {rmse:,.0f}  MAE {err.abs().mean():,.0f}")
13print(f"MAE on the 25 houses {err[:25].abs().mean():,.0f}, on the other 475 {err[25:].abs().mean():,.0f}")1R2 0.949 RMSE 39,600 MAE 23,578
2MAE on the 25 houses 150,000, on the other 475 16,925An R² of 0.949 looks like a strong model. The per-group error shows it is off by 150,000 on one house in twenty, which R² alone gives no sign of.
How to pick a primary metric
Pick the primary metric from the mistake that costs the most in your problem.
| Problem | Costlier mistake | Primary metric |
|---|---|---|
| Cancer screening | missing a sick patient | recall |
| Spam filter | sending a real email to spam | precision |
| Price prediction you act on | a large error in the price | RMSE |
For cancer screening, a missed case can go untreated, while a false alarm leads to a follow-up test, so recall comes first. For a spam filter, losing a real email is worse than letting one spam message through, so precision comes first. For a price model whose output you act on directly, RMSE is in the same units as the price, and squaring the errors before averaging makes large misses count more than small ones.
Which metrics to track alongside it
Next to the primary metric, track two or three supporting metrics that see what it misses. If recall is the primary metric, also watch precision, so you can see how many false alarms each gain in recall costs. In the patient demo, the threshold model's recall of 0.800 came with a precision of 0.044, which means fewer than 1 in 20 flagged patients is actually sick.
Also look at the confusion matrix itself, because an overall number can look fine while one class falls apart. With more than two classes, the matrix has one row per true class and one column per predicted class. Here a three-class model is right most of the time on classes 0 and 1 and mislabels most of class 2 as class 1:
1import torch
2
3torch.manual_seed(0)
4y = torch.cat([torch.zeros(450), torch.ones(450), torch.full((100,), 2)]).long()
5pred = y.clone()
6wrong = torch.rand(1000) < 0.04                # 4% random mistakes on every class
7pred[wrong] = torch.randint(0, 3, (int(wrong.sum()),))
8pred[900:980] = 1                              # the model calls most of class 2 "class 1"
9
10cm = torch.zeros(3, 3, dtype=torch.long)
11cm.index_put_((y, pred), torch.ones(1000, dtype=torch.long), accumulate=True)
12print("accuracy", round((pred == y).float().mean().item(), 3))
13print(cm)                                      # rows = true class, columns = predicted
14print("recall per class", [round(r, 2) for r in (cm.diag() / cm.sum(1)).tolist()])1accuracy 0.893
2tensor([[436, 10, 4],
3 [ 7, 438, 5],
4 [ 1, 80, 19]])
5recall per class [0.97, 0.97, 0.19]Accuracy is 0.893, and the bottom row shows 80 of the 100 class 2 examples predicted as class 1, a recall of 0.19 for that class. If the overall number drops suddenly, or mistakes on one class cost more than the rest, the confusion matrix is usually the first place to check.
Metrics outside classification and regression
The same reasoning carries over to other areas, which keep their own metric lists. NLP uses BLEU and ROUGE, which score generated text by its overlap with reference text, and perplexity, which measures how well a language model predicts held-out text. Computer vision uses mAP and IoU, which score how well predicted boxes or regions match the true ones, and FID, which compares generated images to real ones. Like the metrics above, each of these sees one aspect of a model, so the plan stays the same: one primary metric tied to the cost you care about, and a few others that cover its blind spots.
Common mistakes
- Reporting the easiest number. Accuracy is easy to compute and explain, and on imbalanced data it can rank a model that catches nothing above one that catches most cases.
- Watching the primary metric alone. Pushing recall up by lowering the threshold also pushes false alarms up, and without precision next to it that cost stays invisible.
- Trusting an average. Accuracy, R² and RMSE average over examples, so a class or a group of inputs the model fails on can disappear inside a good overall score. Per-class recall, the confusion matrix, or the error on a specific group shows it.
Related concepts
Precision, recall, F1, and how the decision threshold trades one against the other are covered in the precision, recall, and F1 post. ROC AUC, PR AUC, and why the second is often more useful on rare-class data are covered in the ROC curve and AUC post.
QuiddityML teaches choosing a performance measure as its own concept in the ML Foundation track, right after the classification and regression metrics, with multiple-choice questions on why a single metric is risky and why recall is the primary metric for cancer screening.