5 October 2026 · 8 min read
Regression metrics: MAE, RMSE, R², and MAPE
MAE, RMSE, R² and MAPE are the usual numbers for saying how good a model that predicts prices, sales or other quantities is. This post explains what each one measures, how to compute them in PyTorch, and which one to report for your problem.
A regression metric is a number that says how far a model's predictions are from the true values when the model predicts a quantity, such as a house price or a day's sales. Four of them cover most reports: MAE and RMSE give the typical error in the target's own units, R² says how much of the variation in the data the model explains, and MAPE gives the error as a percentage of the true value. Each one answers a different question, and picking the wrong one can make a weak model look fine or hide a large miss.
Loss function vs evaluation metric
For each example $i$, write $y_i$ for the true value, $\hat y_i$ for the model's prediction, and $n$ for the number of examples. The error on one example is $y_i - \hat y_i$.
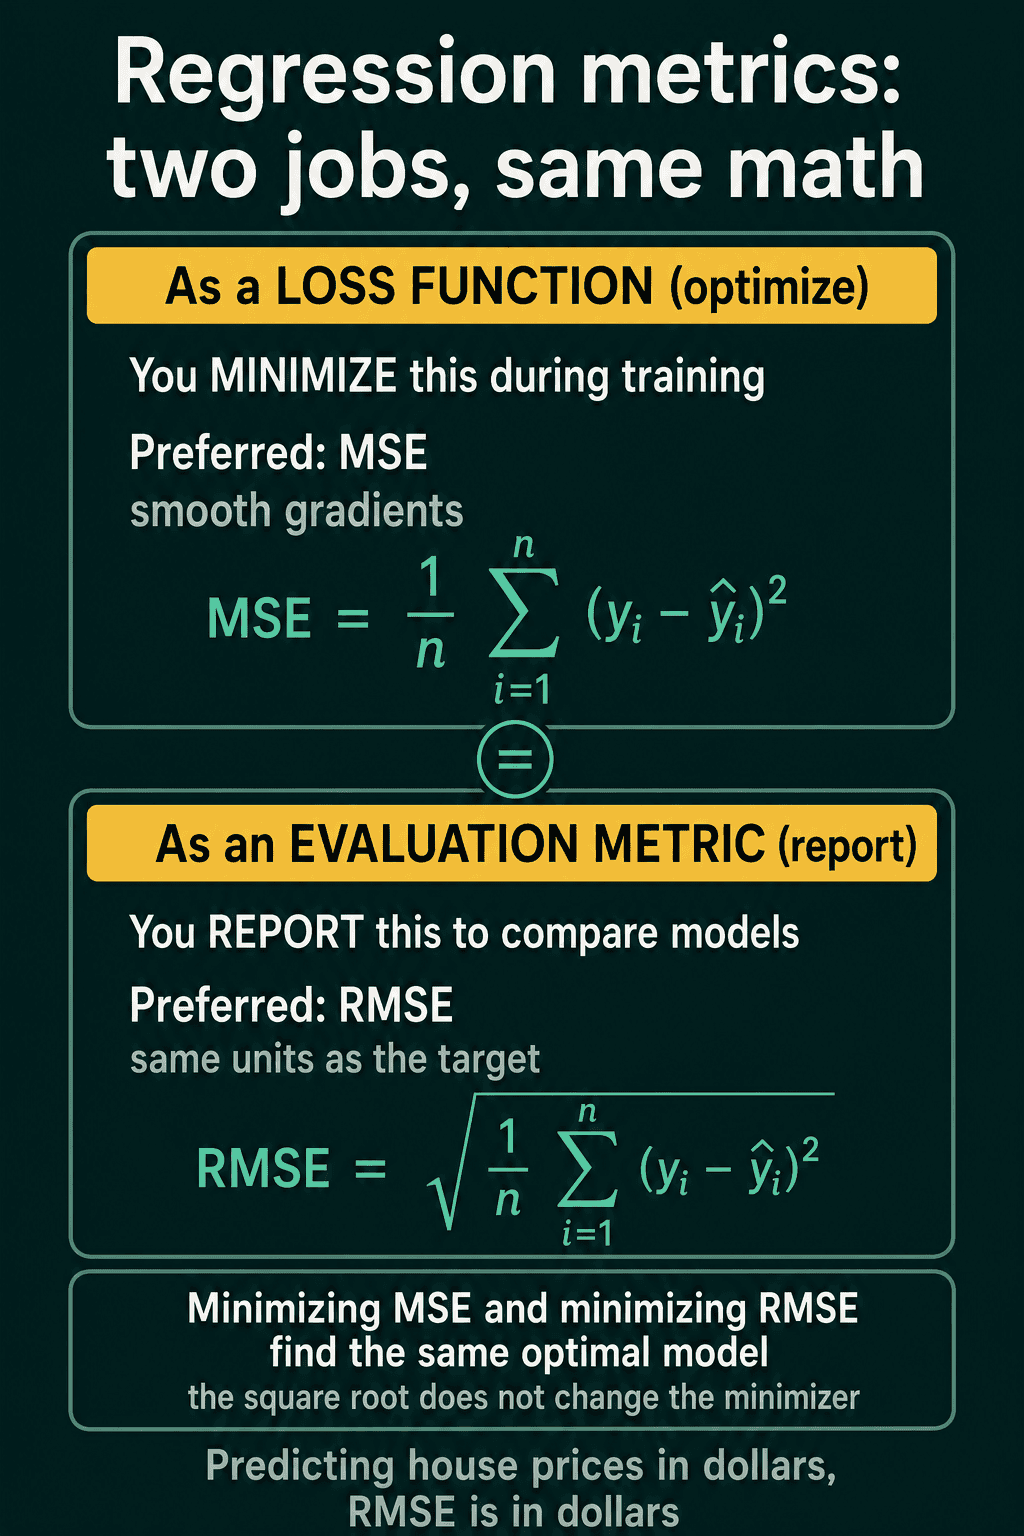
The same error formulas show up in two places. During training, a loss function is the number the optimizer pushes down by adjusting the model's weights. After training, an evaluation metric is the number you report to compare models. The math can be identical while the job is different.
Mean squared error (MSE) averages the squared errors:
$$\text{MSE} = \frac{1}{n}\sum_{i=1}^{n} (y_i - \hat y_i)^2$$
MSE is the usual choice as a loss. Its gradient, the direction in which training nudges each weight, is proportional to the error, so it shrinks smoothly as the predictions get close. As a reported number it is awkward, because squaring also squares the units. A house-price model measured in dollars has an MSE in dollars squared, and if you switch the target to thousands of dollars, MSE drops by a factor of 1,000,000.
Root mean squared error (RMSE) takes the square root of MSE, which puts the number back in the target's units:
$$\text{RMSE} = \sqrt{\frac{1}{n}\sum_{i=1}^{n} (y_i - \hat y_i)^2}$$
The square root keeps the order of the numbers it is applied to, so the weights that give the lowest MSE also give the lowest RMSE. Training on MSE and reporting RMSE is consistent: the model is the same, and RMSE is the version a person can read. If the model predicts house prices in dollars, RMSE is in dollars.
MAE and RMSE on a worked example
Mean absolute error (MAE) averages the size of each error, ignoring its sign:
$$\text{MAE} = \frac{1}{n}\sum_{i=1}^{n} |y_i - \hat y_i|$$
Take a model scored on four houses, with errors of 50,000, 30,000, -10,000 and 10,000 dollars.
- MSE is $(50{,}000^2 + 30{,}000^2 + 10{,}000^2 + 10{,}000^2) / 4 = 9.0 \times 10^8$ dollars squared.
- RMSE is $\sqrt{9.0 \times 10^8} = 30{,}000$ dollars.
- MAE is $(50{,}000 + 30{,}000 + 10{,}000 + 10{,}000) / 4 = 25{,}000$ dollars.
RMSE comes out larger than MAE because squaring gives the 50,000 dollar miss more weight before the square root brings the units back. If someone asks how far off the model usually is, the answer is 25,000 dollars on average (MAE), with RMSE at 30,000 dollars pulled up by the one large miss.
What R² measures
RMSE tells you the typical error in dollars, but not whether 30,000 dollars is good. That depends on how much the prices vary in the first place. R², the coefficient of determination, measures how much of that variation the model explains.
Write $\bar y$ for the mean of the true values. The denominator below adds up how far each true value sits from the mean, which is the total variance of the target. The numerator adds up how far each prediction sits from its true value, the residual variance, meaning the part the model failed to explain.
$$R^2 = 1 - \frac{\sum_i (y_i - \hat y_i)^2}{\sum_i (y_i - \bar y)^2}$$
R² is 1 minus the ratio of what the model missed to what there was to explain, so:
- $R^2 = 1$: perfect predictions, the model explains all the variance.
- $R^2 = 0$: the model is no better than predicting $\bar y$ for each example.
- $R^2 < 0$: predicting the mean for each example would do better than the model.
A worked example: true values $y = [10, 20, 30, 40]$ and predictions $\hat y = [12, 18, 33, 37]$. The mean $\bar y$ is 25. The residual sum is $2^2 + 2^2 + 3^2 + 3^2 = 26$, the total sum is $15^2 + 5^2 + 5^2 + 15^2 = 500$, and $R^2 = 1 - 26/500 = 0.948$. A model that predicts 25 for each example gets a residual sum equal to the total sum, so its R² is exactly 0.
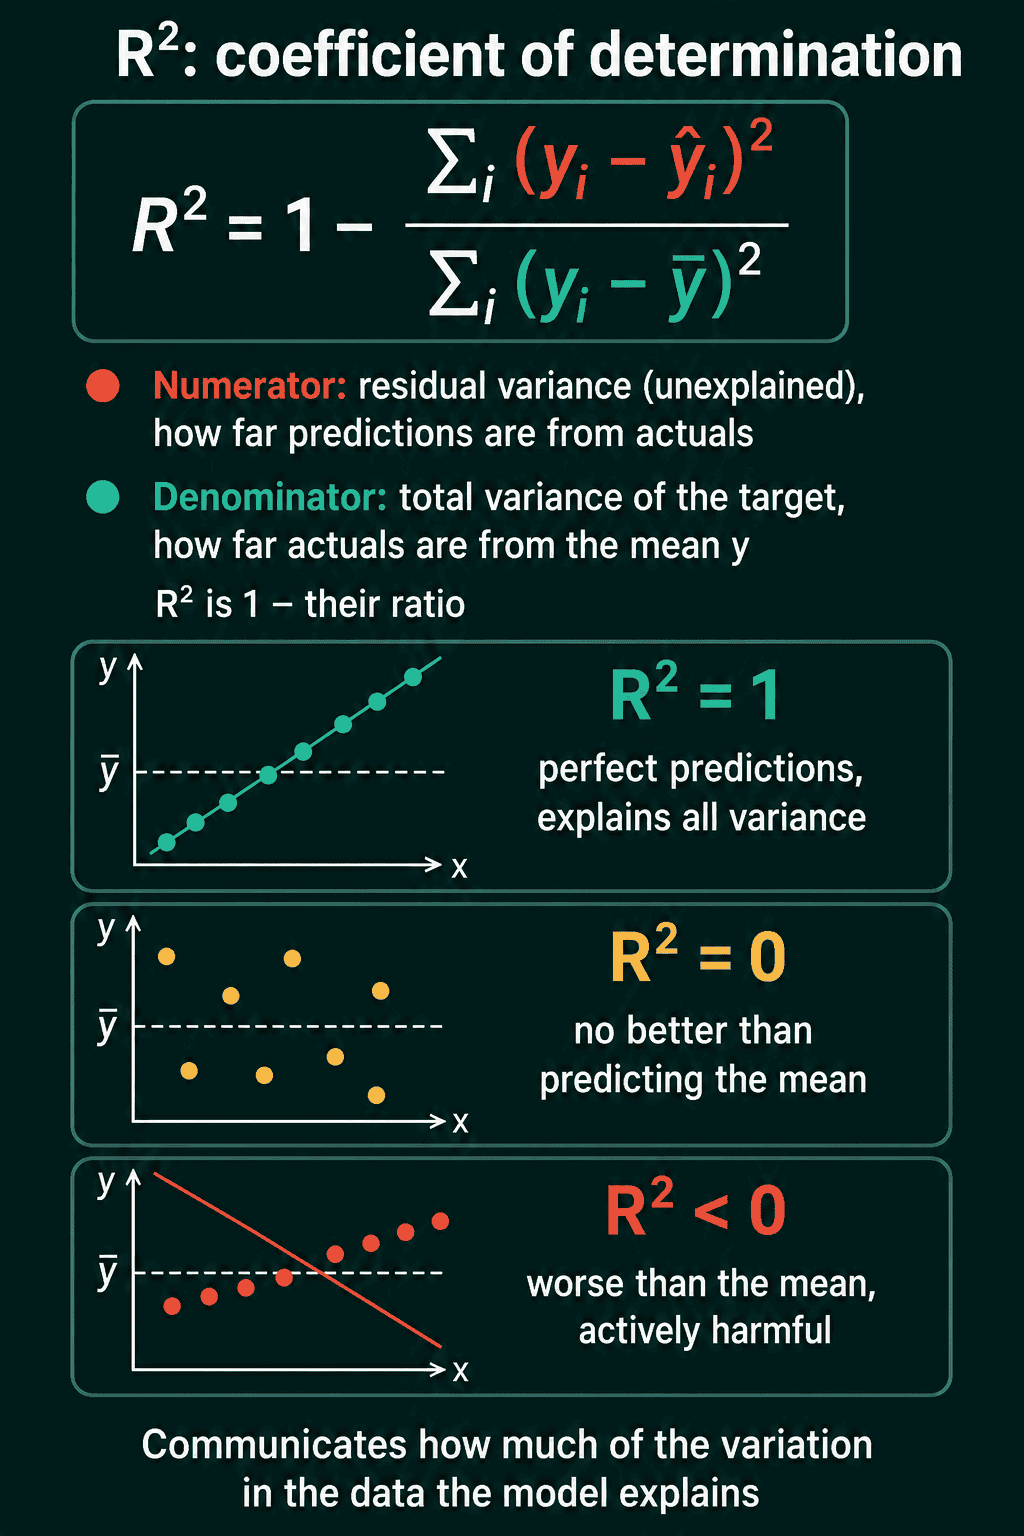
R² is useful when the audience is not technical and the question is "how much of the variation in the data does the model explain?" An R² of 0.948 reads as "about 95%" without anyone needing to know the units.
MAPE: error as a percentage
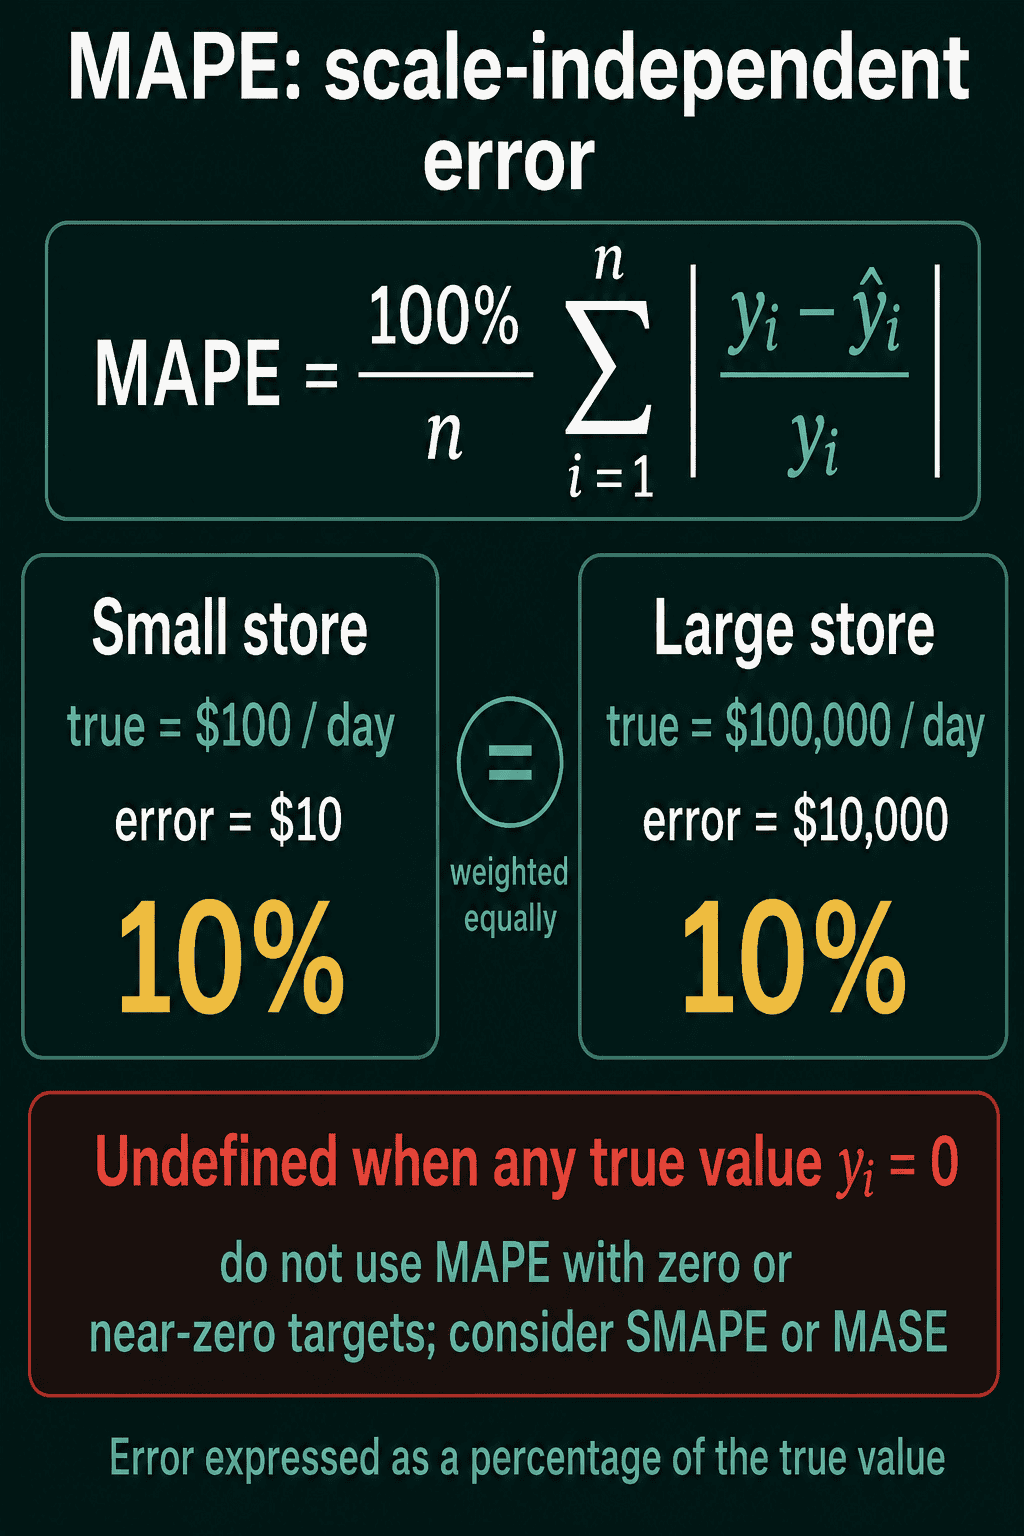
RMSE and MAE are in the target's units, so their size depends on the scale of the target. Say a model forecasts daily sales for a small store that sells 100 dollars a day and a large store that sells 100,000 dollars a day. A 10% miss is 10 dollars for the first and 10,000 dollars for the second, and MAE or MSE averaged over both stores is driven almost entirely by the large one.
Mean absolute percentage error (MAPE) divides each error by its true value, so the error is a percentage of what was actually there:
$$\text{MAPE} = \frac{100%}{n}\sum_{i=1}^{n} \left|\frac{y_i - \hat y_i}{y_i}\right|$$
Each store's 10% miss counts as 10%, and the two stores weigh the same in the average.
MAPE breaks when a true value is zero, since $y_i$ sits in the denominator. The result is undefined or infinite, and targets close to zero make MAPE very large for even a tiny miss. A store with a zero-sales day is a real case of this. If your targets include zeros or values near zero, skip MAPE. Two alternatives handle zeros better: symmetric MAPE (SMAPE), which divides by the average of the true and predicted values, and mean absolute scaled error (MASE), which divides by the error of a simple baseline forecast.
Computing MAE, RMSE, R², and MAPE in PyTorch
The snippet below computes the four metrics on four house prices with the errors from the worked example, then rescales the same prices to thousands of dollars, scores three models with R², and runs MAPE on the two stores and on a target that contains zero.
1import torch
2
3def mae(predictions, targets):
4    return (predictions - targets).abs().mean().item()
5
6def rmse(predictions, targets):
7    return ((predictions - targets) ** 2).mean().sqrt().item()
8
9def r2(predictions, targets):
10    ss_res = ((targets - predictions) ** 2).sum()          # what the model missed
11    ss_tot = ((targets - targets.mean()) ** 2).sum()       # spread of the target around its mean
12    return (1 - ss_res / ss_tot).item()
13
14def mape(predictions, targets):
15    return (((targets - predictions).abs() / targets.abs()).mean() * 100).item()
16
17# four house prices in dollars, and a model that misses by 50k, 30k, -10k, 10k
18targets = torch.tensor([400_000.0, 250_000.0, 310_000.0, 520_000.0])
19predictions = targets - torch.tensor([50_000.0, 30_000.0, -10_000.0, 10_000.0])
20print(f"MSE  {((predictions - targets) ** 2).mean().item():.3g}")
21print(f"MAE  {mae(predictions, targets):,.0f}")
22print(f"RMSE {rmse(predictions, targets):,.0f}")
23print(f"R2   {r2(predictions, targets):.3f}")
24print(f"MAPE {mape(predictions, targets):.2f}%")
25
26# the same model, with prices in thousands of dollars
27t_k, p_k = targets / 1000, predictions / 1000
28print(f"in thousands: MSE {((p_k - t_k) ** 2).mean().item():.0f}  RMSE {rmse(p_k, t_k):.0f}  "
29      f"R2 {r2(p_k, t_k):.3f}  MAPE {mape(p_k, t_k):.2f}%")
30
31# R2 for three models on the same targets
32y = torch.tensor([10.0, 20.0, 30.0, 40.0])
33print(f"good model  R2 {r2(torch.tensor([12.0, 18.0, 33.0, 37.0]), y):.3f}")
34print(f"mean model  R2 {r2(torch.full((4,), y.mean().item()), y):.3f}")
35print(f"wrong slope R2 {r2(torch.tensor([40.0, 30.0, 20.0, 10.0]), y):.3f}")
36
37# two stores, each off by 10%
38stores = torch.tensor([100.0, 100_000.0])
39forecast = torch.tensor([90.0, 90_000.0])
40print(f"stores: MAE {mae(forecast, stores):,.0f}  MAPE {mape(forecast, stores):.1f}%")
41
42# a day with zero sales
43print(f"zero target: MAPE {mape(torch.tensor([1.0, 2.0, 3.0]), torch.tensor([1.0, 0.0, 3.0]))}")1MSE 9e+08
2MAE 25,000
3RMSE 30,000
4R2 0.913
5MAPE 7.41%
6in thousands: MSE 900 RMSE 30 R2 0.913 MAPE 7.41%
7good model R2 0.948
8mean model R2 0.000
9wrong slope R2 -3.000
10stores: MAE 5,005 MAPE 10.0%
11zero target: MAPE infSwitching from dollars to thousands of dollars divides MSE by 1,000,000 (from $9 \times 10^8$ to 900) and RMSE by 1,000 (from 30,000 to 30), while R² stays at 0.913 and MAPE at 7.41%. The model that predicts the wrong slope scores an R² of -3.000, because its residual sum of 2,000 is four times the total sum of 500. On the two stores, MAE is 5,005 dollars, almost entirely the large store's 10,000 dollar miss, while MAPE reports the 10% that both stores share. The zero-sales target gives inf with no error raised, because PyTorch division by zero returns infinity instead of crashing, so a MAPE of inf in your logs usually means a zero in the targets.
Which regression metric to use
- RMSE is a common default for reports when the audience works in the target's units, such as dollars or degrees. It weighs large misses more than MAE.
- MAE reads as the plain average miss and is less pulled by one large error.
- R² is for saying how much of the variation the model explains, especially to people who do not care about the units. Anything at or below 0 means predicting the mean would do as well or better.
- MAPE is for comparing errors across targets on very different scales, such as small and large stores, as long as no target is zero or close to it.
Common mistakes:
- Comparing raw MSE numbers between models whose targets are in different units. A factor of 1,000 in the units becomes a factor of 1,000,000 in MSE.
- Reading a negative R² as a small problem. It means the model loses to a constant prediction of the mean.
- Using MAPE on data with zero targets, which gives
infsilently in PyTorch. - Dividing by the prediction instead of the true value when writing MAPE by hand.
Related concepts
MSE, MAE and RMSE as training losses are covered in what is a loss function. For a model that predicts a class instead of a number, the matching metrics are in the precision, recall, and F1 post and ROC curve and AUC explained. Whichever metric you report, it needs to come from data the model did not see during training, which is what cross-validation explained covers.
QuiddityML teaches RMSE, R² and MAPE as three concepts in the ML Foundation track, with exercises that work out MSE, RMSE and MAE for four house-price errors step by step, compute R² by hand, and spot the missing absolute value in a MAPE function.