By Sagi Shaier · 15 October 2026 · 5 min read
Dependent vs independent variables in machine learning
Which part of a dataset is X and which is y, the other names each one goes by (features, labels, targets, predictors), and how they look as PyTorch tensors.
The dependent variable is the thing a model is trying to predict, and the independent variables are the inputs it uses to make that prediction. The names come from statistics. ML papers and code still use them, often next to newer names for the same two things. Knowing which is which tells you how to split any dataset before training: inputs on one side, the answer on the other.
The dependent variable: what you predict
Say you want to predict the price of a house. The price is the dependent variable, because its value depends on the other facts about the house. In ML notation it is usually written as a lowercase $y$.
The same thing goes by several other names:
- response, common in statistics
- output
- label, common for classification, such as "spam" or "not spam"
- target, common in ML code
All five words point at the same column of your data: the one the model has to learn to produce.
The independent variables: what goes in
The independent variables are the facts you feed the model to make the prediction. For the house, those could be its square footage, its number of bedrooms and its age in years. In ML notation they are usually written as a capital $X$.
They also go by other names:
- predictors
- covariates, common in statistics
- features, the usual word in ML
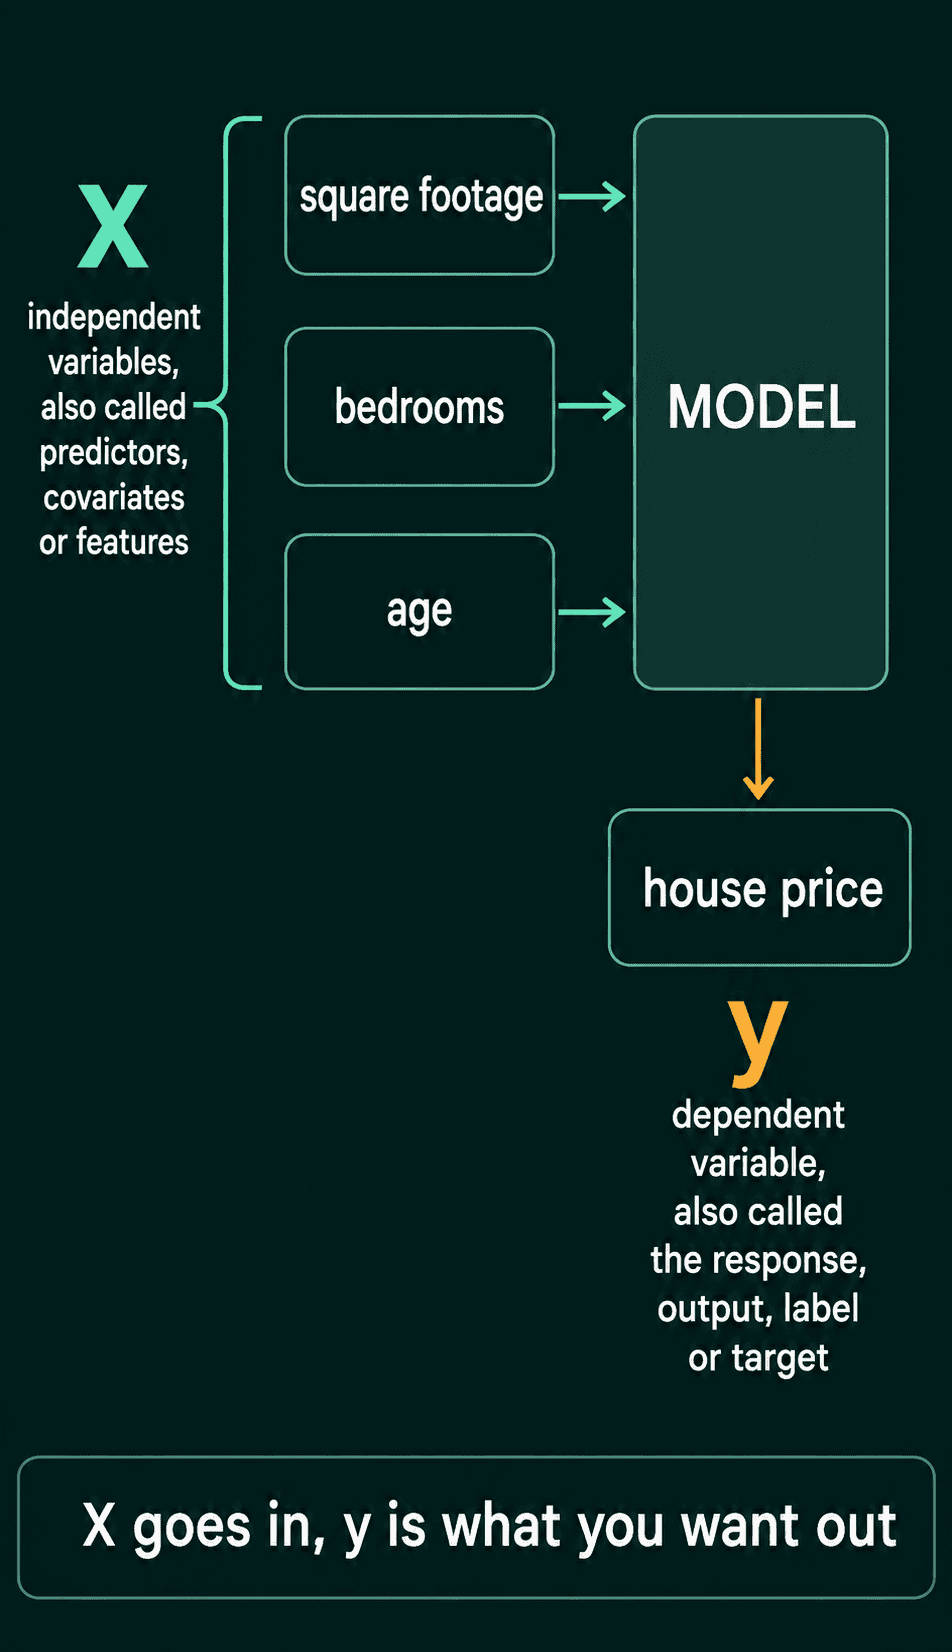
A short way to hold the two apart is that $X$ goes in and $y$ is what you want out.
Why X is a capital letter and y is lowercase
$X$ holds several numbers per example, while $y$ holds one. With four houses and three features each, $X$ is a table with 4 rows and 3 columns, one row per house:
$$X = \begin{bmatrix} 1450 & 3 & 22 \\ 980 & 2 & 41 \\ 2100 & 4 & 6 \\ 1720 & 3 & 15 \end{bmatrix}$$
The first row is a house with 1450 square feet, 3 bedrooms, built 22 years ago. $y$ is a list of 4 prices, one per row of $X$, here in thousands of dollars:
$$y = \begin{bmatrix} 318 \\ 205 \\ 489 \\ 377 \end{bmatrix}$$
Row 3 of $X$ and entry 3 of $y$ belong to the same house: 2100 square feet, 4 bedrooms, 6 years old, priced at 489 thousand. A capital letter for a matrix and a lowercase letter for a vector is a common convention in math, and ML notation follows it.
Supervised learning in one sentence
Supervised learning is training a model on examples where both $X$ and $y$ are known, so it can predict $y$ for new examples where only $X$ is known. Every supervised dataset splits this way. For a spam filter, $X$ is the email's text turned into numbers and $y$ is "spam" or "not spam". For an image classifier, $X$ is the pixel values and $y$ is the class name.
X and y in PyTorch
In code, $X$ and $y$ are two tensors. A tensor is PyTorch's array type, and its shape says how many numbers it holds along each axis:
1import torch
2
3# each row is one house: square footage, bedrooms, age in years
4X = torch.tensor([
5    [1450.0, 3.0, 22.0],
6    [ 980.0, 2.0, 41.0],
7    [2100.0, 4.0,  6.0],
8    [1720.0, 3.0, 15.0],
9])
10# the price of each house, in thousands of dollars
11y = torch.tensor([318.0, 205.0, 489.0, 377.0])
12
13print(X.shape)   # 4 houses, 3 features each
14print(y.shape)   # 4 prices, one per house
15print(X[2], y[2])
16# torch.Size([4, 3])
17# torch.Size([4])
18# tensor([2100.,    4.,    6.]) tensor(489.)
The first axis of both tensors counts houses, so X[2] and y[2] are the features and the price of the same house. When a training loop shuffles the data, it has to shuffle the rows of $X$ and the entries of $y$ together, or the prices end up attached to the wrong houses.
A common shape mistake with y
A model that predicts one number per example returns its predictions as a column. For nn.Linear(3, 1) on 4 houses that column has shape (4, 1), while $y$ has shape (4,). Subtracting the two does not give 4 errors:
1import torch
2import torch.nn.functional as F
3
4X = torch.tensor([
5    [1450.0, 3.0, 22.0],
6    [ 980.0, 2.0, 41.0],
7    [2100.0, 4.0,  6.0],
8    [1720.0, 3.0, 15.0],
9])
10y = torch.tensor([318.0, 205.0, 489.0, 377.0])
11
12model = torch.nn.Linear(in_features=3, out_features=1)
13pred = model(X)
14print(pred.shape)            # one prediction per house, in a column
15print((pred - y).shape)      # (4, 1) minus (4,) broadcasts to (4, 4)
16
17pred = pred.squeeze(1)       # drop the extra axis
18print(pred.shape)            # now matches y
19loss = F.mse_loss(pred, y)
20# torch.Size([4, 1])
21# torch.Size([4, 4])
22# torch.Size([4])
PyTorch broadcasting stretches the (4, 1) column and the (4,) row against each other. Every prediction is compared with every price, which gives 16 errors instead of 4. Training still runs and the loss is wrong. F.mse_loss prints a warning about the size mismatch, which is the first thing to look for when a regression model's loss refuses to go down. squeeze(1) on the predictions, or unsqueeze(1) on $y$, makes the shapes match.
Two meanings of "independent"
"Independent variables" does not mean the features are independent of each other. Square footage and bedroom count usually rise together, and both still count as independent variables, because "independent" here only says which side of the model they sit on.
Probability uses the same word for something else. Two events are independent when knowing one tells you nothing about the other: a coin flip and a die roll, for example. That meaning describes a relationship between two random quantities and has nothing to do with inputs and outputs. When an ML text says "independent," the sentence around it usually makes clear which one it means: "the independent variables" is about inputs, and "independent samples" is about probability.
Common mistakes
- Putting the target inside $X$. If the price column is left in the feature table, the model can copy it and score perfectly in training. Drop $y$'s column from $X$ before training.
- Mismatched rows. Sorting or filtering $X$ without doing the same to $y$ attaches answers to the wrong examples.
- Shape
(N, 1)vs(N,). Predictions and targets with different shapes broadcast into a square table of errors.
Related concepts
Joint and conditional probability describe how likely values of $X$ and $y$ are together, and a classifier's output is the probability of each label given the input, written $p(y \mid x)$. Linear regression is the simplest model that maps $X$ to a number $y$, a weighted sum of the features plus a constant. Loss functions measure how far the model's predictions are from $y$.
QuiddityML teaches dependent and independent variables as a concept in the Math track's probability unit, and the exercises on it include sorting synonyms like label, covariate and target into the $X$ side or the $y$ side.